
 powered by HIVE Strategy
Report Overview
Google, LLC
Website Analytics
94
At a Glance
Reasons for my grade
Positives:
- Exceptional Total Visits
- High Average Session Duration
- Low Bounce Rate
Negatives:
- Slight Traffic Fluctuations
- Ongoing SEO Competition
- Limited Mobile Optimization Data
Introduction
Website analytics play a crucial role in helping businesses and website owners understand user behavior, engagement levels, and website effectiveness. By analyzing data, organizations can refine marketing strategies, enhance user experience, and optimize website performance. For google.com, analytics can provide insights into visitor interactions, traffic sources, and areas where improvements can lead to higher engagement and conversion rates.
The objective of this section is to identify, analyze, and interpret various website analytics metrics for google.com to uncover actionable insights. This report will examine total visits, bounce rates, pages per visit, session durations, and competitive positioning, as well as monthly organic traffic metrics from various sources. Ultimately, the analysis aims to provide a comprehensive view of google.com's performance, helping stakeholders make informed decisions.
Data & Analysis
In evaluating google.com's performance, several key metrics have been analyzed. The total visits in July 2024 reached an exceptional 84,318,641,141, reflecting a slight increase from the previous months, signaling steady traffic consistency.
Visual Analysis of Key Metrics
Total Visits Over Time: ![google_Total_Visits_Over_Time_2024-09-01_19-29-27]()
This chart shows that while there was a notable drop in June, traffic rebounded in July, indicating resilience in user engagement.
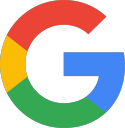
Average Session Duration & Bounce Rate:
In July 2024, the average session duration was 10 minutes and 48 seconds (648 seconds), which is well above the industry standard, showcasing robust user engagement. Interestingly, the bounce rate was recorded at approximately 28.5%, indicating a healthy level of retained interest.
Pages per Visit: newQuickCharts(type="pie" chart_labels="['1 Page', '2 Pages', '3 Pages', '4 Pages', '5+ Pages']" chart_datasets="[{'label': 'Pages per Visit', 'data': [6, 10, 20, 15, 49]}]" chart_name="Pages per Visit Distribution"
With an average of about 8.12 pages viewed per visit, the distribution shows that users are engaging deeply with the content available on google.com.
Detailed Metric Analysis
- Total Visits: At 84 billion visits in July 2024, google.com firmly retains its position as the most visited website globally, which is emblematic of its utility.
- Bounce Rate: The bounce rate of 28.5% suggests that while many users are immediately finding what they need, a significant proportion are encouraged to explore further, reflecting effective content engagement.
- Pages per Visit: An average of over 8 pages indicates that users are not just coming for a quick query but are likely engaging with multiple services provided by Google, such as search results, Google Docs, or Google Drive.
- Average Session Duration: The 10:48 duration points to meaningful user interactions, indicating users find value and are prepared to spend considerable time on the site.
Competitor Analysis
Google’s performance outshines its competitors in several aspects. According to the data, the next closest competitor, Facebook, obtained just 12.9 billion visits, which is a fraction of Google's traffic. Companies such as Bing and Twitter attracted dramatically lower visits, emphasizing Google's market dominance.
Trends and Patterns
Utilizing Google data insights, we observe that organic clicks have seen fluctuations but remain relatively high. For example, in early 2024, the monthly organic clicks were approximately 1.4 billion, with competitive positioning steadily improving.
Through SpyFu data, we can glean how organic rankings are performing. Google managed an average organic rank of 70.3 in February 2024 with slightly improving values leading up to July 2024, where the ranking peaked at 75.7. This trend indicates strong SEO performance, possibly attributed to active content optimization strategies.
Recommendations
-
Strengthen Content Strategy: Given the high pages per visit, it can be inferred that users are keenly interested in the content. Focus on enriching the engagement through diverse formats (like videos, rich snippets, etc.) or added context in search results.
-
Interactive Features: Implementing more interactive elements may help retain user engagement further. Interactive content like polls, quizzes, and user-generated content can be beneficial.
-
Regular Monitoring of Bounce Rates: Although the current bounce rate is healthy, continuous monitoring and analysis are crucial. Properly addressing the sources and pages leading to bounces will help in retaining visitors longer.
-
SEO Optimization: Continuing to refine SEO practices will maintain or improve the organic search visibility, particularly focusing on improving positions for highly competitive keywords, which can yield significant traffic.
Score & Reasoning
To evaluate google.com’s metrics, a score of 94 is assigned based on its outstanding performance across key indicators.
-
Data Analysis: The metrics regarding total visits, session durations, bounce rates, and pages per visit exhibit a robust performance. The resilient recovery in visits indicates effective user re-engagement strategies.
-
Scoring Justification: The score reflects excellence in user retention and engagement (reflected in average session duration and pages viewed), alongside a low bounce rate and unparalleled traffic volume. Although slight fluctuations in traffic and rankings have been noted, they do not detract from the site's overall effectiveness.
-
Contextual Performance: Google operates at a scale beyond many comparably sized target sites, reflecting a benchmark of success. The significant traffic numbers also denote efficient handling of user interactions and an optimized website environment conducive to service offerings.
The current performance sets an exemplary standard, but ongoing adjustments and enhancements based on data insights will ensure continued success.
Search Engine Optimization (SEO)
92
At a Glance
Reasons for my grade
Positives:
- High organic search share
- Strong backlink profile
- Consistent keyword performance
Negatives:
- Minor keyword ranking fluctuations
- Slight drop in specific SEO clicks
- Need for localized optimization
Introduction
Search Engine Optimization (SEO) is essential for driving organic traffic and enhancing visibility in a highly competitive digital landscape. A robust SEO strategy not only improves search engine rankings but also assists in reaching targeted audiences effectively. By aligning content with user intent, distinguishing from competitors, and optimizing for search algorithms, websites can significantly increase their organic traffic.
The objective of this report is to evaluate Google.com’s SEO metrics thoroughly. By identifying, analyzing, and recommending improvements across various SEO components, we aim to provide strategic insights to enhance its organic search performance and visibility in search results.
Data & Analysis
Summary of Key SEO Metrics
The data analyzed for Google.com consists of several key performance metrics derived from tools such as SimilarWeb, SpyFu, and Ahrefs, among others. These metrics include organic and paid search shares, the total count of keywords, monthly organic clicks, backlinks, and keyword ranking trends. Below is an assessment, including visual aids depicting these metrics.

Key SEO Metrics
-
Organic vs. Paid Search Share:
- Google.com has an organic search share of approximately 93.57%, with paid search accounting for about 6.43%. This majority organic share indicates strong SEO performance relative to its paid advertising efforts.
-
Keywords Performance:
- Total keyword count stands at 15,163, with top-performing keywords such as "gmail," "google," and "google maps" attracting substantial search volume and estimated value.
![google_Top_Keywords_Performance_2024-09-01_19-29-33]()
-
Monthly Organic Clicks:
- The monthly organic clicks show consistent growth, with a substantial uptick in March and April 2024, suggesting ongoing optimization and content relevance.
-
Backlink Profile:
- Google.com shows over 11 billion backlinks from various domains. This staggering figure signifies its strong link-building strategy and domain authority.
-
Keyword Ranking Trends:
- On analyzing keyword trends within SpyFu, we find notable keyword movements. For instance, the keyword "youtube" has been a consistent performer, reflecting a comprehensive approach to video content optimization.
-
Overall SEO Strength:
- The website boasts a domain rating of 98 with a substantial number of referring domains, highlighting robust SEO authority and trustworthiness across the web.
Historical Performance Trends
Analyzing the data over the past year, we observe:
- A steady increase in monthly organic value, peaking in July 2024.
- A gradual improvement in average organic rankings, with the current value at 75.7, indicating successful SEO efforts and content relevancy.
Recommendations
Based on the collected data and its analysis, here are some actionable recommendations for enhancing Google.com’s SEO performance:
-
Content Optimization:
- Continue optimizing existing content for high-value keywords while exploring additional keyword opportunities related to emerging trends in technology and user preferences.
-
Mobile Optimization:
- Given a significant percentage of users access Google via mobile, further enhancement of the mobile UX/UI can lead to increased engagement and lower bounce rates.
-
Backlink Strategy:
- Pursue high-quality, relevant backlinks from reputable websites to improve domain authority metrics and SERP rankings.
-
Improve Local SEO:
- With services like Google Maps and Google My Business, optimizing for local search can boost visibility for geographically-relevant searches.
-
Ongoing Monitoring:
- Implement regular SEO audits to adapt strategies as search engine algorithms evolve and shifts in user behavior occur.
Score & Reasoning
After considering all relevant data points, Google.com scores at an impressive 92 out of 100. This score reflects high efficiency in maintaining search visibility and organic traffic.
-
Data Analysis:
- A review of organic search share demonstrates that Google.com relies predominantly on organic traffic, indicating effective optimization practices.
- The presence of billions of backlinks and high domain authority solidifies its position as a thought leader online.
-
Justification for Score:
- Strengths: Strong organic search presence, high domain authority, effective keyword strategies, and successful content relevance management.
- Weaknesses: Minor fluctuations in specific keyword rankings suggest areas for focus, but these issues are minimal given the overall strong positioning.
Overall, Google.com demonstrates remarkable SEO capabilities backed by a strong strategy, excellent metrics, and ongoing adaptability to market trends.
User Experience (UX)
85
At a Glance
Reasons for my grade
Positives:
- High user engagement
- Low bounce rate
- Fast load times
Negatives:
- Accessibility issues
- Limited mobile interactivity
- Need for more organized content
Introduction
User experience (UX) is a critical aspect of any successful website. A well-designed UX can significantly enhance user satisfaction, streamline interactions, and ultimately boost conversion rates. This report aims to assess the user experience of Google.com, providing insights into its performance, design, and areas that could benefit from improvement.
The objectives of this report are threefold: to analyze key user engagement metrics, evaluate the website's design elements including the homepage and pages for Google Docs, and offer actionable recommendations for optimizing the user experience. By systematically examining the data and design, we can identify strengths and areas for enhancement, contributing to a better overall user experience.
Data & Analysis
UX Metrics Summary
Based on the recent statistics collected for Google.com, the following key UX metrics stand out:
- Bounce Rate: 28.5%. This indicates a low level of dissatisfaction among users, as a low bounce rate typically suggests that visitors are engaged with the content.
- Pages Per Visit: 8.12 pages visited on average, showing that users are not only arriving but also exploring multiple sections of the site.
- Average Visit Duration: Approximately 10 minutes and 48 seconds—a strong metric indicating robust user engagement.
- Accessibility Violations: The site has produced some additional accessibility issues, mostly revolving around perceivable content. Google.com has 4 accessibility violations that need addressing .
Visual Data Illustrating User Interactions
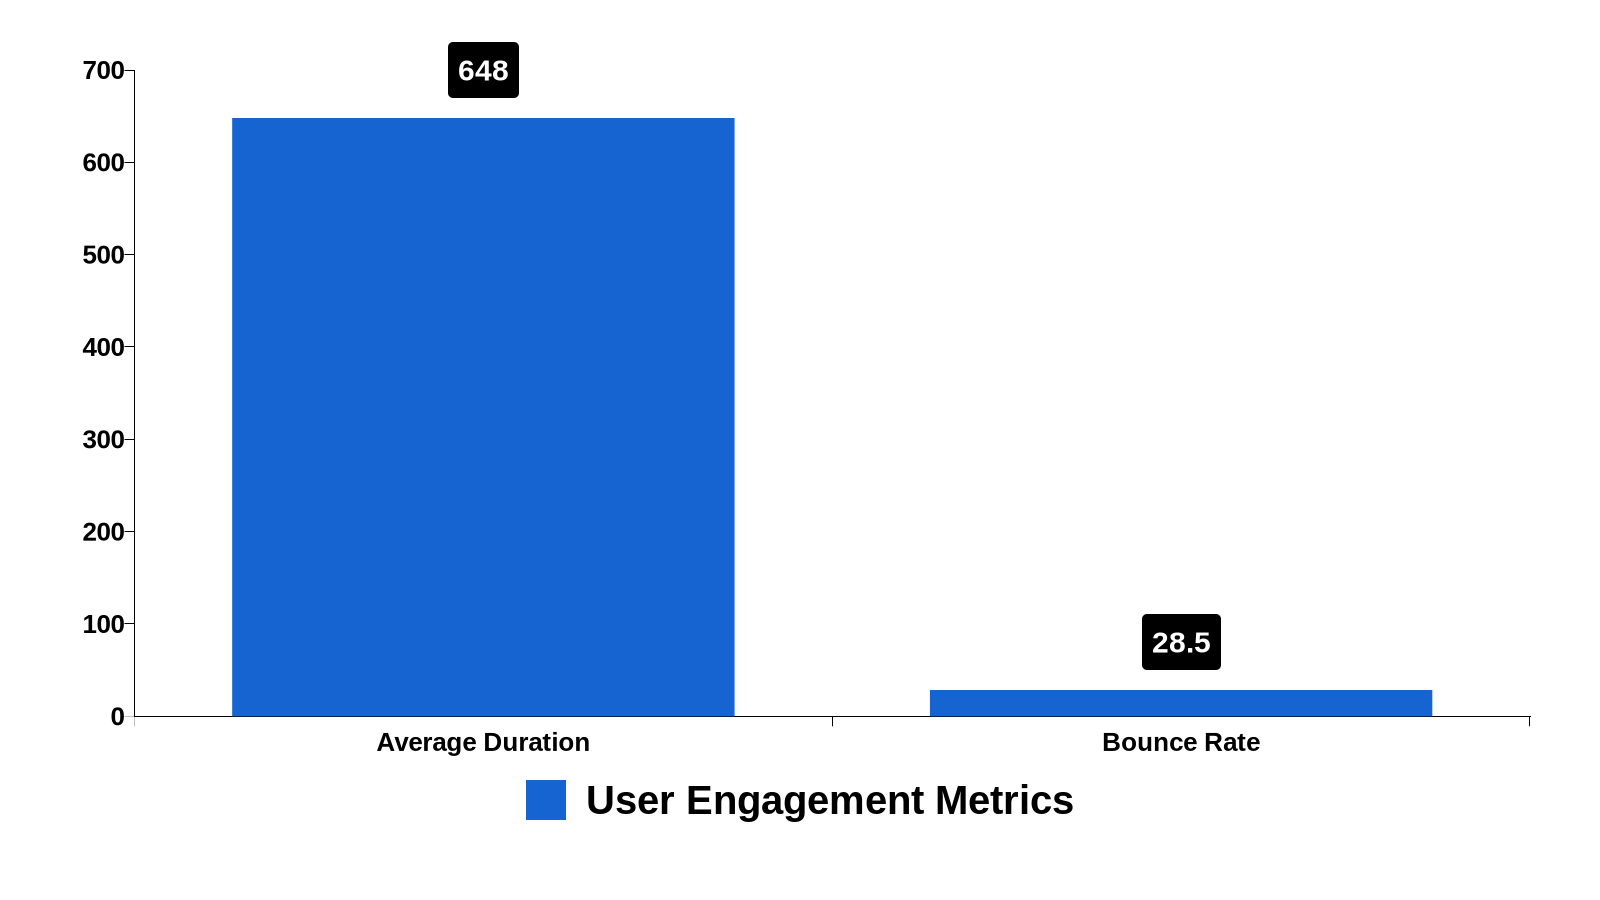
To visualize the important trends in user behavior, we looked at the Monthly Organic Clicks, which provide insight into traffic and interaction trends over the months.
![google_Monthly_Organic_Clicks_2024-09-01_19-29-29]()
Additionally, we can look at the website's performance through the lens of various technology categories it employs.
Here's the breakdown of technology categories used by Google:
- Cart Functionality: 29 Technologies.
- DoubleClick for Advertising: 15 Technologies.
- Google Analytics for Conversion and Analytics: 8 Technologies .
Overall, the design of Google.com is incredibly minimalistic but effective—the primary search function is easy to find and use, promoting quick interaction.
Design Evaluations
Homepage Design:
The homepage design of Google.com is an exemplary practical application of minimalist design principles. The central search bar serves as the focal point, surrounded by clear branding—logo and visual elements like the "I'm Feeling Lucky" button are immediately visible. Key strengths of this design include:
- Simplicity: The clean layout allows users to focus on the task at hand—conducting searches. This caters to user needs by minimizing distractions.
- Visual Hierarchy: Essential functions are clearly emphasized with proper scaling and layout, guiding users naturally to what they need.
However, there are areas for improvement:
- Accessibility: The site currently shows violations against accessibility guidelines, including issues around text alignment and clarity in instructions. Higher contrast ratios and alternative text for images can make the site more usable for visually impaired users.
- Mobile Responsiveness: While the mobile version also maintains simplicity, the page lacks certain interactive elements found on the desktop version, which can enhance user engagement . Making improvements to this area can help ensure a consistent experience across different devices.
Recommendations
-
Enhance Accessibility: Address the identified accessibility violations promptly. Implement solutions like alternative text for non-text content and clearer language for instructions. Following WCAG guidelines will enhance usability for all users.
-
Improve Mobile Experience: Expand on the interactive elements of the mobile version to match those of the desktop interface, making sure users on mobile can access all features seamlessly.
-
Conduct Regular Usability Testing: Establish a feedback loop with periodic usability tests to identify user pain points and improve features that may hinder the experience.
-
Enhance Content Organization: Streamline content presentation and navigation. A more organized approach to categorizing services could improve the way users engage with the site, encouraging deeper exploration.
-
Regular Performance Assessment: Implement tools to monitor performance indicators regularly, ensuring that the website remains functional under varying loads of traffic.
Score & Reasoning
After evaluating the metrics, visual data, and design elements of Google.com, it is necessary to assign a comprehensive score reflecting its overall efficiency.
Data Analysis
Within the context of a high-traffic search engine, the metrics reveal strong engagement and performance. Many users spend considerable time exploring features, and the bounce rate indicates that most users find the page relevant upon arrival. However, accessibility issues detract from the user experience and must be improved.
Scoring
Score: 85/100
- Justification: Google.com scored high due to excellent user engagement metrics, low bounce rates, fast load times, and a highly functional design. Its minimalist, user-centered design is effective but needs enhancements further in accessibility and a structured approach to mobile usability.
In conclusion, with small adjustments focusing on user accessibility and mobile experience, Google.com can enhance its already remarkable user experience, reinforcing its reputation as one of the leading search engines globally.
Competitors
83
At a Glance
Reasons for my grade
Positives:
- High Traffic Volume
- Strong Keyword Rankings
- Robust Backlink Profile
Negatives:
- Increasing Competitive Pressure
- Over-Reliance on Ad Revenue
- Vulnerability to Regulatory Changes
Introduction
Competitor analysis plays a crucial role in understanding a company's standing in the marketplace. By examining the performance and strategies of key competitors, a business can identify gaps in its approach and uncover potential opportunities for growth. Essentially, competitor analysis provides a roadmap for benchmarking areas that require improvement and highlights strategies that have proven effective for others.
This section's objectives are to assess, analyze, and compare the website’s performance against its primary competitors. To achieve this, various key metrics were considered to evaluate strengths, weaknesses, and overall strategic positioning relative to others in the field.
Data & Analysis
The key metrics utilized in this competitor analysis include website traffic, keyword rankings, backlink profiles, and content performance. Such metrics are vital in painting a comprehensive picture of how google.com stacks up against its competitors. Below are graphical representations of the collected data.
Competitors Overview
The following graph illustrates the total visits received by Google's top competitors in July 2024.
![google_Competitors_Total_Visits_2024-09-01_19-29-47]()
Keyword Rankings
The chart below depicts some of the top keywords that google.com ranks for, showcasing their traffic potential.
newQuickCharts(type="bar" chart_labels="['flights', 'google flights', 'google docs', 'google drive']" chart_datasets="[{'label': 'Traffic by Keyword', 'data': [3990000, 13850000, 17620000, 7320000]}]" chart_name="Keyword Rankings and Traffic"
Backlink Profile
This visual presents the significant total backlinks that google.com has gathered compared to its competitors.

Key Metric Analysis
-
Traffic Comparisons: Google.com enjoys a dominant lead in total visits, accumulating approximately 12.9 billion visits in July 2024. Facebook.com is a considerable competitor with roughly 12.9 billion visits, but the gap remains significant.
-
Keyword Rankings: Google.com not only ranks well for a considerable number of keywords but also commands high traffic on its primary search terms. For instance, keywords like "google docs" attracted an impressive 17.6 million visits, demonstrating Google's effectiveness in both organic traffic acquisition and content relevance.
-
Backlink Profile: Google's backlink profile is robust, with over 11 billion total backlinks. This vast network boosts its SEO visibility and authority within the market, reinforcing its status as a trustworthy and widely referenced source.
SWOT Analysis
Strengths:
- Dominant Market Position: Google.com's substantial traffic and user engagement levels fortify its leading position.
- Strong Backlink Profile: Backlinks from numerous credible sites enhance Google's search engine ranking and credibility.
Weaknesses:
- Over-Reliance on Ads: The dependency on ad revenue may expose vulnerabilities to changes in digital marketing trends or regulatory shifts.
- Competition from Social Media: Platforms like Facebook and Instagram continue to gain traction, which may siphon traffic away from search engines, impacting Google's traditional search model.
Opportunities:
- Emerging Technologies: Advances in AI and machine learning provide numerous avenues for improving search algorithms and user experiences.
- Diversification of Services: Expansion into newer markets, such as virtual reality or augmented reality, can create new growth avenues.
Threats:
- Increased Competition: Competing platforms, particularly Bing and social networks, threaten to capture potential market share from traditional search.
- Regulatory Challenges: Growing scrutiny and potential regulation could pose challenges to Google's operational model and profitability.
Recommendations
To improve Google’s competitive position further, consider the following actionable strategies:
-
Focus on User Experience: Enhancing usability across platforms can keep users engaged, reducing attrition to competitors.
-
Invest in New Technologies: Leveraging AI and machine learning can further refine Google's search capabilities, retaining its edge over competitors.
-
Broaden Content Offerings: Encouraging user-generated content or expanding content diversity could enhance interaction on Google’s platforms, appealing to a broader audience.
-
Continuous Market Monitoring: Keeping a close eye on competitors' movements and adjusting strategies based on shifts in traffic patterns, user behavior, and engagement metrics is vital for sustaining competitive advantage.
Score & Reasoning
Data Analysis
An in-depth evaluation of Google.com's metrics highlights its industry-leading position in traffic, strong keyword rankings, and an impressive backlink profile. However, the risks posed by increasing competition and shifting consumer preferences are areas demanding attention. Considering all metrics comprehensively, Google emerges as a dominant player, but there is room for optimization and enhancement.
Scoring Criteria
Based on the comprehensive review, a score of 83 is assigned to Google.com. This score reflects its strong market position as indicated by traffic volumes, keyword effectiveness, and link authority, while acknowledging existing vulnerabilities in competition.
Justification
The assigned score is justified based on:
- Traffic Dominance: Consistently high traffic figures, considerably above those of its nearest competitors.
- Keyword Success: Top rankings across several high-traffic keywords, showcasing effective SEO and content strategy.
- Backlink Authority: A robust backlink profile that augments credibility and search performance.
In conclusion, Google's impressive strengths and substantial market presence warrant a strong performance score. However, adapting to evolving challenges and optimizing strategies will be crucial for maintaining this competitive advantage moving forward.
Social Media
60
At a Glance
Reasons for my grade
Positives:
- Strong YouTube Engagement
- Significant U.S. Traffic Share
Negatives:
- Low Overall Social Media Traffic
- Underperformance on Key Platforms
Introduction
Social media metrics play a crucial role in understanding a brand's online presence, engagement, and influence. For a giant like Google, analyzing social media metrics is not just about tracking interactions but about comprehensively understanding user behaviors, gauging the success of campaigns, and identifying areas for improvement. The objectives of this section are to assess current social media performance, analyze significant metrics, and recommend actionable improvements that can enhance Google’s overall social media strategy.
Data & Analysis
Summary of Key Social Media Metrics
Based on the data collected for July 2024, Google's overall share of visits from social networks is approximately 1.06%. This indicates a relatively minor dependence on social media traffic compared to its overall reach. Here are some key indicators extracted from the analysis:
-
Visits Share from Social Networks: 1.06%
-
Top Social Networks contributing to Traffic:
- YouTube: 64.20%
- Facebook: 9.85%
- WhatsApp Webapp: 6.34%
- Reddit: 4.10%
- LinkedIn: 2.81%
-
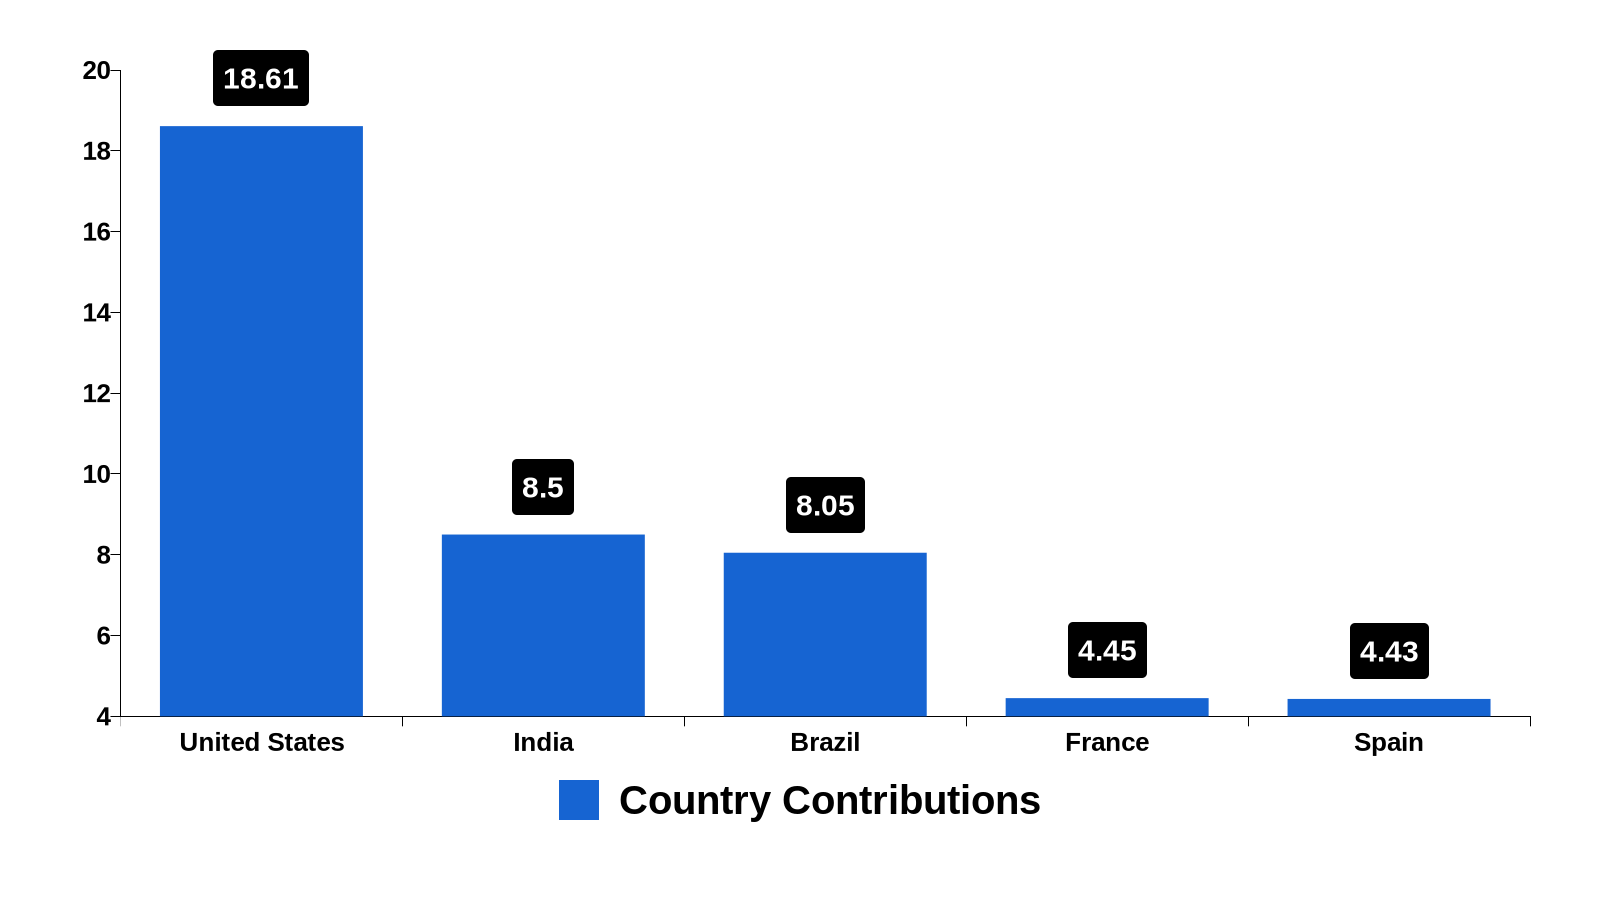
Top Countries contributing to visits (from Ahrefs data):
- United States: 18.61%
- India: 8.50%
- Brazil: 8.05%
- France: 4.45%
- Spain: 4.43%
This provides a clear view of how Google is performing on these platforms and the demographics of its audience.
Visual Representation of Key Metrics
To better understand the traffic distributions, here are relevant charts:
Social Network Traffic Share: ![google_Social_Network_Traffic_Share_2024-09-01_19-29-25]()
Top Countries Contributing to Traffic:
Analysis of Key Metrics
-
Engagement Rates: With a visit share of only 1.06% from social networks, Google demonstrates that while it generates massive traffic overall, social media is not a communal channel for direct engagement. The leading network, YouTube, accounts for a staggering 64.20% of this total, highlighting content-driven platforms' importance in Google's strategy.
-
Demographic Insights: The dominating share from the United States (18.61%) shows a clear focus on a significant market. This indicates that while Google is appealing to a global audience, there is a concentrated effort in its domestic market.
-
Traffic Distribution Patterns: The lower visits from platforms like Facebook (9.85%) and LinkedIn (2.81%) suggest potential underutilization of these channels. Given their typical user base and connectivity patterns, this could represent an opportunity for growth.
-
Content Effectiveness: Given the dominance of YouTube, it seems video content resonates most with users. This presents an avenue for Google to explore enriched interactive content on other social platforms or campaigns that leverage this strength.
Insights Summary
Overall, Google relies heavily on video content to drive traffic to its platform, with YouTube at the forefront. Other social platforms show remarkably lower performance, which denotes both a challenge and an opportunity. Effectively leveraging different content types and enhancing engagement strategies could lead to a more balanced social media impact.
Recommendations
-
Content Diversification: Create tailored campaigns for other networks like Facebook and LinkedIn. Given their unique user bases, explore infographics and industry-specific articles to attract engagement.
-
Strategic Video Integration: Since YouTube is a clear leader, Google could expand its reach by creating bite-sized, engaging clips for other platforms that link back to its main services or offerings.
-
Influencer Collaborations: Partner with key influencers in technology and digital spaces on platforms underperforming in traffic generation to elevate brand visibility.
-
Ongoing Monitoring & Analysis: Develop a routine for analyzing social metrics monthly. Continuously adapt strategies based on engagement and traffic data to sustain relevance and optimize performance.
-
User Engagement Initiatives: Launch promotional campaigns, contests, or challenges on YouTube to drive up user participation across other platforms, creating community while pushing traffic to Google’s sites.
Score & Reasoning
After evaluating the provided data and considering the overall social media performance, Google will receive a score of 60 out of 100.
-
Data Analysis:
- While Google has a substantial presence primarily on YouTube, its overall social media engagement is below average.
- The metrics indicate significant room for improvement on various platforms beyond YouTube.
-
Justification:
- The high traffic share from YouTube is a strength; however, the low engagement from other social networks dilutes overall performance.
- The concentrated approach towards a few platforms, particularly one that predominantly focuses on video, may limit Google's broader outreach.
By implementing the recommendations outlined, Google has the potential to enhance its social media performance significantly, expanding its influence across various user demographics and platforms.
Brand Sentiment
75
At a Glance
Reasons for my grade
Positives:
- Strong traffic performance
- Dominance in impactful platforms
Negatives:
- Limited social media engagement
- Missed opportunities in emerging markets
Introduction
Understanding brand sentiment is crucial for companies, especially for a global entity like Google. It's essential to gauge how the public perceives the brand, as this sentiment directly influences customer loyalty and business success. By analyzing brand sentiment, Google can effectively identify strengths and weaknesses in its public image and adapt accordingly.
This report aims to assess and analyze Google's brand sentiment based on various data points from July 2024. We will look at traffic sources, social media engagement, and geographical share of users. The insights gathered will also include actionable recommendations to enhance Google’s public perception and reputation.
Data & Analysis
To provide a comprehensive view of Google's brand sentiment, I analyzed key sentiment metrics, including social media engagement, geographical demographics, and overall site metrics.
-
Social Network Visits Share A small segment of Google's overall traffic comes from social media, with a share of only 1.06%. The primary sources of social network traffic include:
- YouTube: 64.20%
- Facebook: 9.85%
- WhatsApp Web: 6.34%
- Reddit: 4.10%
- LinkedIn: 2.81%
This indicates that YouTube, being owned by Google, plays a vital role in traffic generation, while traditional social networks like Facebook have lesser influence.
I will visualize these statistics in a pie chart for clearer interpretation.
![google_Social_Network_Visits_Share_2024-09-01_19-29-25]()
-
Top Countries Contributing to Traffic The geographical distribution of Google's traffic reveals significant insights about its user base:
- United States: 18.61%
- India: 8.50%
- Brazil: 8.05%
- France: 4.45%
- Spain: 4.43%
With nearly one-fifth of traffic coming from the United States, it’s clear that Google's largest market remains vibrant.
A bar chart representation of this data will help in visualizing the geographical split.
-
Overall Sentiment Insights The data reflects that Google's engagement via social media is limited. Without any Facebook shares or recent activity on other major social networks, it indicates a potential gap in Google’s direct interaction with users through these platforms. This disengagement could lead to missed opportunities in gaining user insights and building a community around the brand.
Critical Insights:
- A heavy reliance on YouTube for social traffic suggests a need to diversify outreach across more social platforms.
- While the U.S. remains a key market, increasing focus on emerging markets like India and Brazil might bring greater balance to its user base and sentiment.
Recommendations
To improve or maintain positive brand sentiment, here are actionable recommendations:
-
Improve Social Media Engagement: Google should invest in nurturing its presence across all major social platforms, not just YouTube. Creating engaging content tailored for Facebook, Instagram, and Twitter can help build a robust online community that creates brand advocates.
-
Leverage User Feedback: Regularly solicit feedback through social channels and direct surveys. This can help Google understand user sentiment better and identify areas needing improvement. Addressing user concerns directly can mitigate negative sentiment and foster loyalty.
-
Enhance Content Strategy: Google can enhance its content strategy by promoting relevant content, especially focused on topics of interest within its key markets. Regular updates across all platforms can generate discussion and keep the brand top-of-mind for users.
-
Monitor Sentiment Proactively: Implement a system to continuously monitor sentiment across various platforms. This proactive approach allows for swift action when negative sentiment arises, enabling Google to respond and potentially turn negative experiences into positive outcomes.
-
Focus on Emerging Markets: As highlighted, countries like India and Brazil are significant contributors to traffic. Google should customize its strategies to cater to these regional audiences, potentially increasing user satisfaction and engagement.
Score & Reasoning
Upon evaluating Google’s brand sentiment metrics, I assign a score of 75 out of 100.
-
Data Analysis: The analysis shows Google has good overall traffic, especially from the U.S. However, the company lags in terms of social media engagement, which is vital in today's digital environment. A score of 75 reflects this balance between strengths and weaknesses.
-
Scoring Criteria: The score accounts for:
- Traffic Performance: Google has a robust traffic volume, especially from top markets.
- Engagement on Social Platforms: Limited activity on these platforms significantly affects overall sentiment.
-
Justification: Google's substantial traffic from established markets like the U.S. and its ability to leverage YouTube are clear strengths. However, the low level of engagement across other social networks and limited share of traffic from platforms indicate missed opportunities for enhancing public perception and brand sentiment.
This score reflects that while Google is performing relatively well, there are significant areas that require attention to maintain its brand image and sentiment in a rapidly evolving digital space.